Monthly Update: Energy
The Partnership sends updates for the most important economic indicators each month. If you would like to opt-in to receive these updates, please click here.
Estimated Read Time: 2 minute
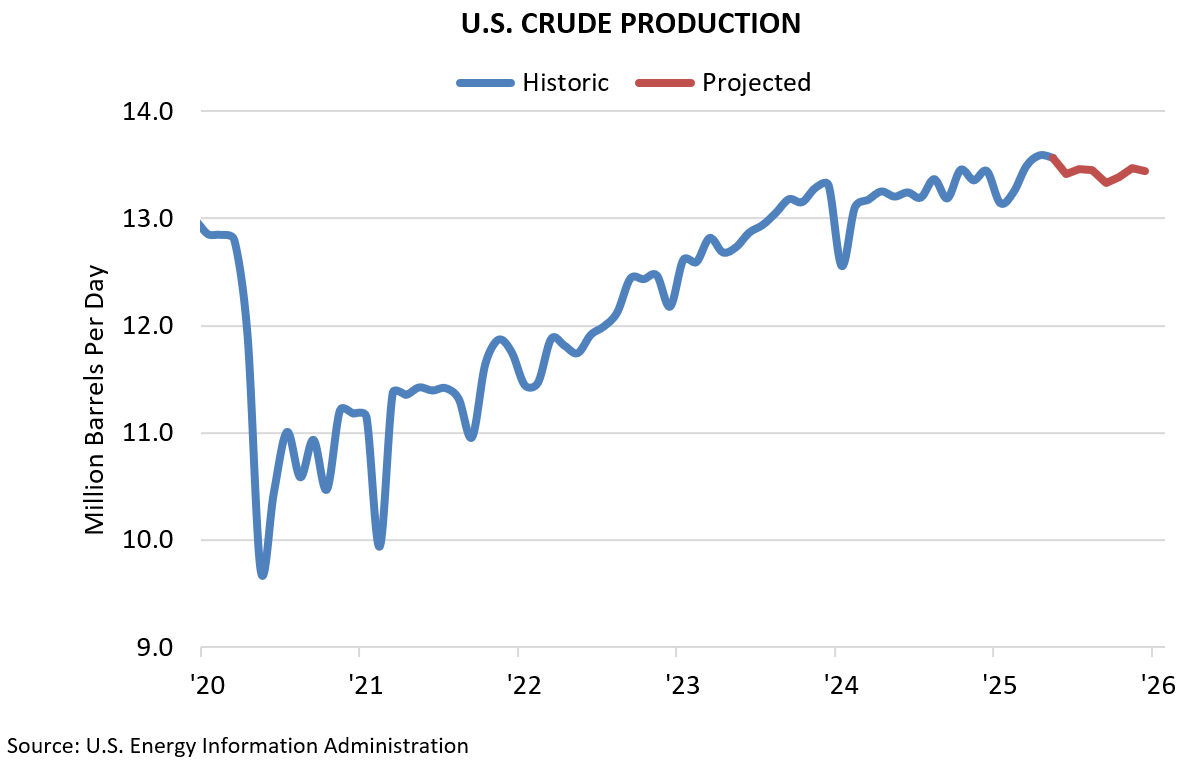
U.S. CRUDE PRODUCTION
The U.S. Energy Information Administration (EIA) estimates that domestic crude production held steady at 13.6 million barrels per day (b/d) between April and May. While this represents an increase from the recent low of 13.1 million b/d in January, the EIA predicts production will level off during the next few months, dropping to 13.4 million b/d in December. The EIA previously expected U.S. production to grow for the rest of ’25 but slowing global demand and the announcement of increased production from OPEC+ will drive prices down and cause U.S. producers to cut back on new drilling.
CRUDE PRICES
West Texas Intermediate (WTI) prices fell to an average of $62.17 in May from $63.54 in April following the OPEC announcement. The EIA projects that prices will continue to decline the rest of the year as cheaper oil from OPEC+ hits the market and U.S. inventories grow, reaching $57.00 per barrel in December.
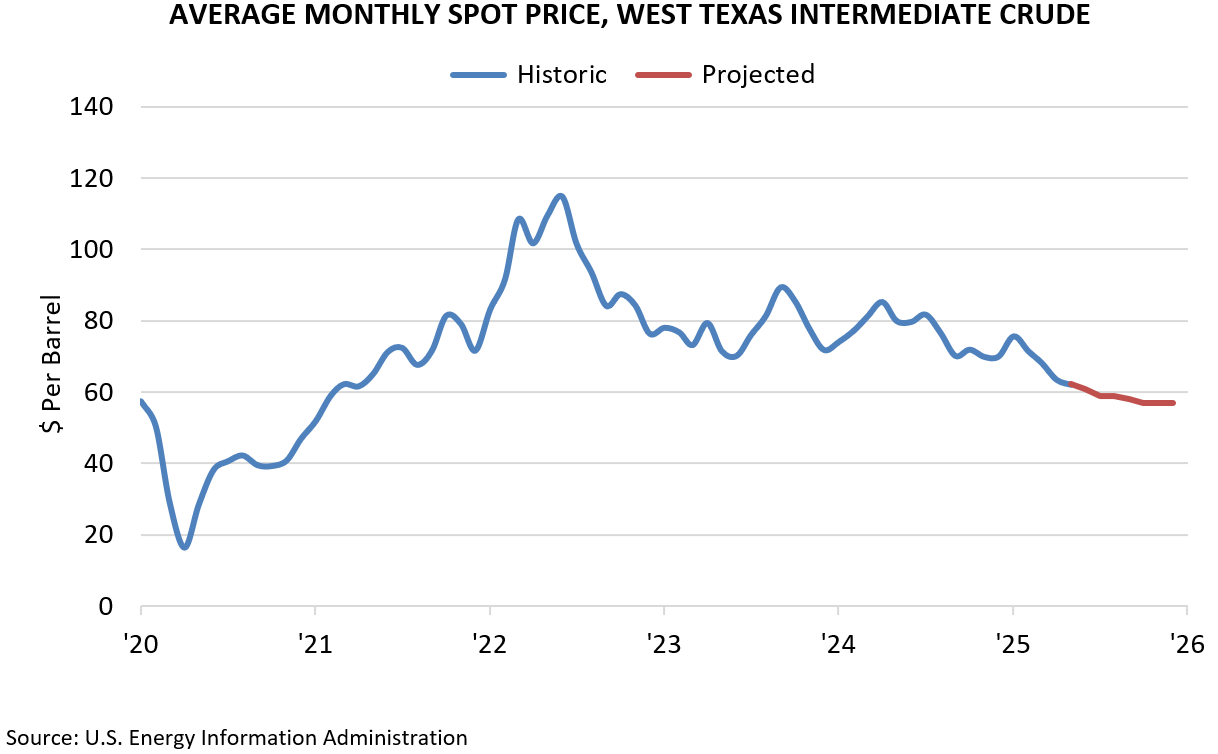
Global demand has softened, contributing to the falling prices. Worldwide consumption of oil and other liquid fuels is down year-over-year at 102.6 million b/d in May ’25 compared to 102.9 in May ‘24. The EIA projects consumption will recover and grow to 105.3 million b/d by year’s end.
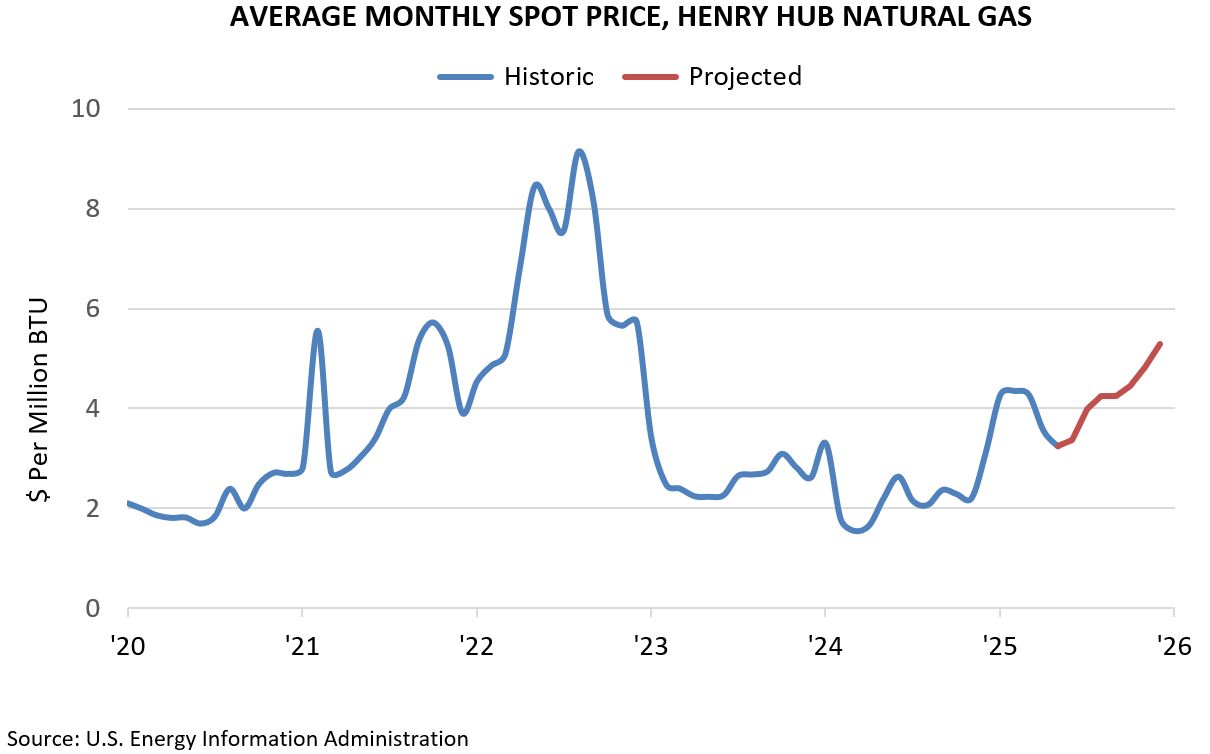
NATURAL GAS
U.S. natural gas production increased to 105.7 billion cubic feet per day in May ’25 vs 101.5 billion in May ’24. Domestic natural gas inventories expanded to 2,636 billion cubic feet last month as warmer weather meant less gas was needed for heating. The EIA expects natural gas prices will rise from $3.24 per million British Thermal Units (BTU) in May to $5.28 per million BTUs in December as strong global demand leads U.S. exports of LNG to outpace domestic consumption.
Prepared by Greater Houston Partnership Research.
Colin Baker
Manager of Economic Research
Greater Houston Partnership
bakerc@houston.org
Clara Richardson
Research Analyst
Greater Houston Partnership
crichardson@houston.org