Secondary Nav

Data, Insight & Analysis

0
Recent Downloads

Economy at a Glance - May 2025

In this issue of Glance, the Partnership examines Houston's central role in the global economy, with a focus on its trade volumes in ’24.
Published on 5/5/25

GLOBAL HOUSTON

On May 1, the Greater Houston Partnership released its Global Houston ‘25 report. The full report can be found at the Partnership’s website. A summary of the document follows. Note: The newsletter includes updates to data not available at the time the original publication was sent to the printer.

The global economy is expected to continue growing in ’25. But recent changes to U.S. trade policy are likely to temper that growth, with the International Monetary Fund (IMF) revising its global growth forecast for ’25 down to 2.8 percent in April from 3.3 percent in January. Parts of Houston’s economy may be vulnerable to slowing global growth or increased trade tensions. But its relationships with other countries are deep and multi-faceted:

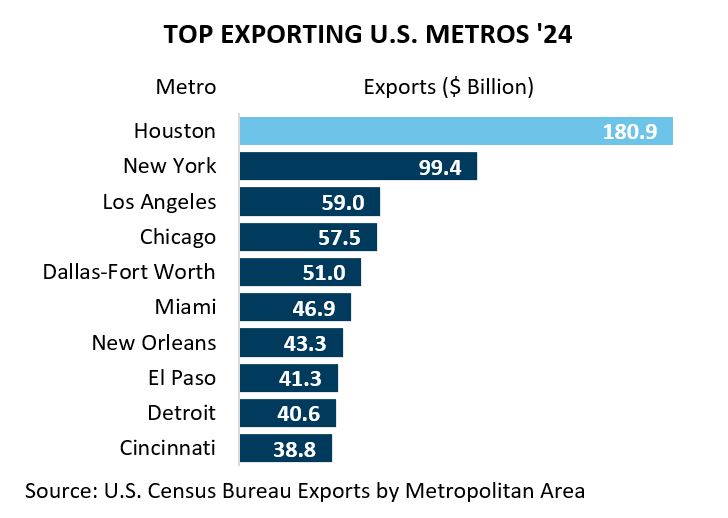
  • Houston consistently exports more goods and commodities than any other U.S. metro.
  • The Houston/Galveston Customs District routinely handles more foreign tonnage than any other U.S. customs district. 
  • Almost 1,000 foreign-owned firms operate over 1,800 offices, factories, warehouses, and service centers in Houston.
  • Almost 150 Houston-based firms operate over 3,200 business establishments across 111 foreign countries.
  • Over 1.8 million Houston residents, nearly one in every four, were born outside the U.S.
  • Eighteen foreign banks, 41 foreign chambers of commerce and trade associations, and 11 trade and commercial offices promote trade and investment in the region.
  • Eighty-six foreign governments have consulates or honorary consuls in Houston.

These ties have benefited the region’s economy in years past and will continue to be important to its success in ’25.

Metro Houston Exports

Houston led the nation in exports in ’24, shipping $180.9 billion in goods and commodities abroad. This is more than the combined value for New York and Los Angeles, the second and third highest exporting metros. Houston has ranked as the nation’s top exporting metro in 12 out of the past 13 years. The exception was in ’16, when OPEC flooded the market with crude and oil traded under $50 per barrel most of the year. Those conditions limited exports of oil and oil field equipment from Houston. 

Houston’s export value has increased by 3.1 percent since ’23 and now totals $51.3 billion – 39.6 percent higher than in ’19, before the COVID-19 pandemic.

The metro data above comes from the U.S. Census Bureau’s origin of movement (OM) series, which tracks goods based on the metro from which they began their export journey. For example, a medical device may be manufactured in Houston, then flown to New York where it’s transferred via airplane to Europe. Though the export leaves the U.S. via New York, it began its journey in Houston. Census considers that as a Houston export. 

The International Trade Administration (ITA) estimates that Texas exports supported over 1.2 million jobs in ’22 (the latest year for which data is available). Since Houston accounted for around 40 percent of the state’s exports, a back-of-the-envelope calculation suggests that roughly 480,000 Houston jobs—more than one in seven—were tied to exports. But this simple calculation probably understates the full economic impact of Houston’s foreign-facing businesses, as it does not account for capital investment or services provided for foreign clients.

Customs District Traffic

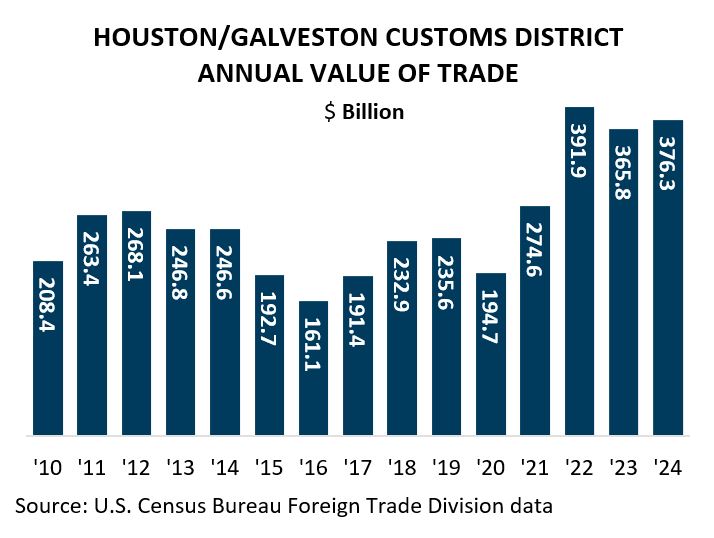
The Houston/Galveston Customs District set a tonnage record in ’24. The eight ports that comprise the district handled over 432.6 million metric tons of goods and commodities, a 6.6 percent increase from ’23. Those shipments were valued at $376.3 billion, up 2.9 percent over ’23. This value is still down 4.0 percent from the record high of $391.9 billion set in ’22.

Customs district data differs from the origin of movement (OM) data in that district data reflects what passes through a region, which doesn’t necessarily correspond with where an item was produced or consumed. However, for Houston, customs district exports align with the region’s industrial base. 

In ’24, the Houston/Galveston district exported $1.0  billion or more of the following products: crude oil and refined petroleum products, industrial equipment and computers, organic chemicals, electrical machinery and parts, plastics and plastic products, automobiles and automobile parts, articles of iron and steel, alcoholic beverages and vinegars, instruments and measuring devices, iron and steel, aircraft parts, home furnishings, pharmaceuticals, rubber and rubber products, inorganic chemicals, rare earths and precious metals, industrial components, toys and games, and cereal grains, aluminum and aluminum products, copper and copper products, essential oils and cosmetics, meats, wood and wood products, fruits and nuts, mineral ores, stone and plaster products, and linens.

Exports via the Houston/Galveston district consistently exceed imports. They accounted for 66.7 percent of all cargo value handled by the district in ’24. By comparison, exports accounted for 20.4 percent of the Los Angeles district’s exports, 30.5 percent of New York’s, and 37.5 percent of Laredo’s.

To continue reading, download this report.

Note: The geographic area referred to in this publication as “Houston,” "Houston Area” and “Metro Houston” is the ten-county Census designated metropolitan statistical area of Houston-Pasadena-The Woodlands-Sugar Land, TX. The ten counties are: Austin, Brazoria, Chambers, Fort Bend, Galveston, Harris, Liberty, Montgomery, San Jacinto, and Waller.

Key May Takeaways

Here are the facts to know about the Houston region this month
1
May Takeaway #1
Houston is the top exporting U.S. metro, with $180.9 billion in goods and commodities sent abroad last year.
2
May Takeaway #2
Energy remains key to Houston’s trade, with oil and refined petroleum products accounting for 52.1 percent of its total trade value.
3
May Takeaway #3
The region reached new records with 13.1 million international passengers handled by its airports and 3.4 million loaded container units processed at Port Houston.

Previous Issues of Economy at a Glance

APR
2025
Population Growth and Employment Revisions
Read Report
MAR
2025
Houston’s GDP growth and industry diversification
Read Report
FEB
2025
Houston's Economy In ’24
Read Report
JAN
2025
'25 Employment Forecast
Read Report
DEC
2024
Economic and Demographic Differences Within the Houston Metro
Read Report
NOV
2024
Houston’s Demographics Compared to the Largest Metros
Read Report
OCT
2024
Economic, Demographic, Housing, and Social Characteristics Over Time
Read Report
SEPT
2024
The Fracking Boom and Bust, Energy Transition Investments
Read Report
AUG
2024
Hurricane Beryl, New Businesses, Demographics, and Employment Trends
Read Report
JUL
2024
Current state of Houston's economy
Read Report
JUN
2024
Population Growth, the Housing Market, and the latest Kinder Houston Area Survey
Read Report
MAY
2024
Houston’s Ties to the Global Economy
Read Report
APR
2024
Population Gains, Relocations and Expansions, Housing Affordability, and Job Growth
Read Report
MAR
2024
The pandemic’s impact on Houston
Read Report
FEB
2024
Local and U.S. economic trends
Read Report
JAN
2024
Employment Forecast Summary, Houston GDP, and Job Growth
Read Report
DEC
2023
Houston exports, employment, the business climate in Texas, and a peek into Partnership’s forecast for 2024
Read Report
NOV
2023
Houston’s population compared to other major U.S. metros
Read Report
OCT
2023
Shifts in Houston’s Demography
Read Report
SEPT
2023
The Houston Ship Channel, the outlook for business in Texas, and local employment trends
Read Report
AUG
2023
The Pivot from Recession to Resilience
Read Report
JUL
2023
Mid-Year Report
Read Report
JUN
2023
The Global Economy, Home Sales, and Construction
Read Report
MAY
2023
U.S. Economic Outlook and Houston's Energy Industry
Read Report
APR
2023
Houston's population growth and employment revisions
Read Report
MAR
2023
U.S. Recession and Houston's Key Indicators
Read Report
FEB
2023
The Year in Review
Read Report
JAN
2023
The U.S. Economy and Houston's GDP Estimates
Read Report
DEC
2022
Recovery in the Oil and Gas Industry
Read Report
NOV
2022
Metro Houston's Job Growth and the Apartment Market
Read Report
OCT
2022
Exploring Population Changes Through the ACS
Read Report
SEPT
2022
Recession? Maybe, Maybe Not
Read Report
AUG
2022
Houston at Mid-Year
Read Report
JUL
2022
The Houston Housing Market, Affordability, and Recent Shifts
Read Report
JUN
2022
Economic Recovery, Population Growth & Global Houston recap
Read Report
MAY
2022
Economic recovery, rising costs & labor force
Read Report
APR
2022
Population growth and employment data
Read Report
MAR
2022
Local Impact of a Global Event
Read Report
FEB
2022
Post-Analysis of 2021 Houston Economy
Read Report
JAN
2022
Omicron, GDP, Employment
Read Report
DEC
2021
2022 Employment Forecast
Read Report
NOV
2021
Job Gains, Real Estate, Exports
Read Report
OCT
2021
Inflation, Employment & Global Innovation
Read Report
SEP
2021
Employment, Oil & Gas, Containerized Exports, and Housing
Read Report
AUG
2021
Delta Variant, Rebounding Travel, Economic Growth and Population Gains
Read Report
JUL
2021
Energy Transition, Recovery Bottlenecks, & the Worker Shortage
Read Report
JUN
2021
Economic Recovery, Multifamily, Population & More
Read Report
May
2021
Housing Boom and Robust Recovery
Read Report
APR
2021
Pandemic Recovery, Tech Workforce
Read Report
MAR
2021
Pandemic Employment Data
Read Report
FEB
2021
Coronavirus Impact and 2021 Outlook
Read Report
JAN
2021
Racial Demographics and Population Shifts
Read Report
NOV
2020
U.S. Recovery, 2021 Outlook
Read Report
OCT
2020
U.S. Recovery, Houston Update
Read Report
SEP
2020
COVID-19 Impact on Economy
Read Report
AUG
2020
Energy Change Over Time
Read Report
JUL
2020
COVID-19 Update, Houston Unemployment
Read Report
JUN
2020
COVID-19 Update, Affected Sectors, Energy
Read Report
MAY
2020
U.S. & Texas Outlook, GDP
Read Report
APR
2020
COVID-19 Update, PMI, Industry Outlook
Read Report
MAR
2020
Economic Impact, Global Outlook, Recession Probability
Read Report
FEB
2020
U.S.-China Trade Deal, USMCA
Read Report
JAN
2020
Houston GDP, Energy, Jobs
Read Report
DEC
2019
Sector by Sector Forecast for 2020
Read Report
NOV
2019
Houston Region Demographic Update 2
Read Report
OCT
2019
Houston Region Demographic Update 1
Read Report
SEP
2019
Houston's Growth Engines
Read Report
AUG
2019
PMI, Commercial Real Estate & Housing
Read Report

More Insight & Analysis

Monthly Update: Inflation

Review the latest data on inflation in the Houston area. 

Monthly Update: Employment

Review the latest data on jobs in the Houston region. 

Monthly Update: Purchasing Managers Index

Review the latest data on this key economic indicator. 

Get more in-depth analysis from the Partnership team with a Membership.
Executive Partners